


If you know how to understand the reports and extract data, useful and relevant to your business, Google Analytics can be a powerful tool. At the end of the day, it all comes down to conversion rates. Although optimal conversion rates are harder to achieve, it’s not impossible. There are many performance marketing tips on how to increase your conversion rates in a day. Here are 10 best practices you should implement to achieve higher conversions from Google Analytics.
1. Focus on relevant KPIs
The usual mistakes with Google Analytics involve getting caught up in the reports without knowing exactly which metrics to monitor and track. While it may be fun to review these reports, it becomes meaningless if those metrics don’t align with your business objectives. It’s important to chalk up 5-10 KPIs that will affect your business operations and not get distracted by "vanity metrics" like the number of visits to your website. Once you have your key KPIs sorted out, you can get valuable insights on metrics that help you achieve your website or business objectives. Forget about the irrelevant data and review reports that are of supreme importance.
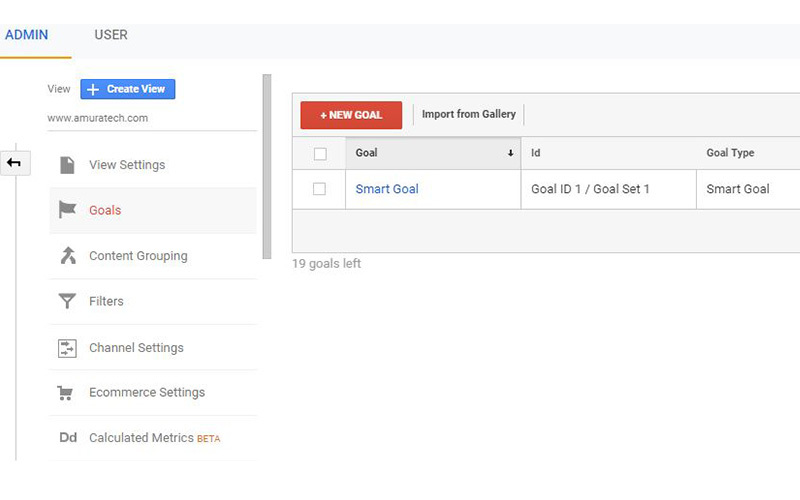
2. Define and Set Goals
Just like your website needs to fulfill SMART business objectives, your Google Analytics should be reconfigured to measure conversions against some defined goals. That way, when you measure these conversions, it will act as a confirmation that you are on the right track to achieve your business objectives. When you measure conversions using goals, your conversion rate becomes the most important KPI, whatever the objective of your website might be. In case of more than one goal, assigning an arbitrary monetary value to each goal helps, even if the value isn’t exactly aligned to a transaction’s purchase value. This allows getting closer to your business objectives regarding goals that have a bigger impact on your business.
3. Configure Analytics Properly
After setting up your Google Analytics account, ensure that you measure the most important aspects of your business. Doing this is necessary to make sure that your data is accurate. You can also access additional instruments so that you can make your traffic analysis better. Follow the below checklist for Google Analytics that will help you properly setup:
- Set up and track events
- Track campaigns
- Set up for e-commerce
- Set up tracking for website search
- Enable reports for demographics and interests
- Track keywords and speed of the website
- Use experiments to track improvements
- Learn multi-channel funnels and apply attribution modeling
- Link your AdWords and AdSense account to Analytics
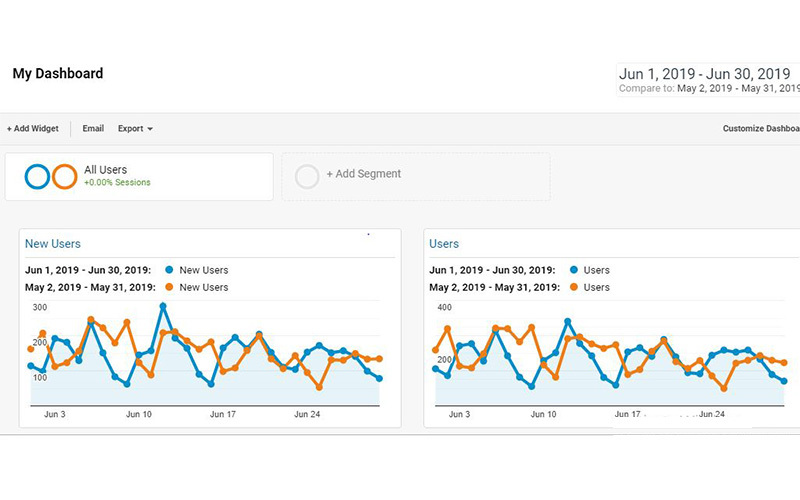
4. Generate Custom Dashboards & Reports
Google Analytics gives you the option to generate custom dashboards. You can quickly access the most important data that focus exclusively on the KPIs pertinent to your business goals. Analytics allows you to create up to 20 dashboards. However, it’s recommended to strictly focus on only the relevant metrics that you’ve already identified. You also get access to a Solutions Gallery of ready-to-use dashboard templates submitted by other users. While you get multiple templates options, choose the ones that align with your defined metrics as these dashboard templates are very effective. You can also create custom reports through Google Analytics. This is a great way to generate reports specifically designed for your objectives.
5. Regularly Review Reports
It’s one thing to design your custom reports in details, but they would be useless if you are not reviewing them regularly. It’s recommended that you keep a close tab on your metrics and review your main KPIs weekly. When it comes to reports, make sure you conduct a thorough review at least once in a month. Also, when you make any major updates, immediately follow up on your website review to check that the updates don’t negatively affect the performance or if there have been any improvements.
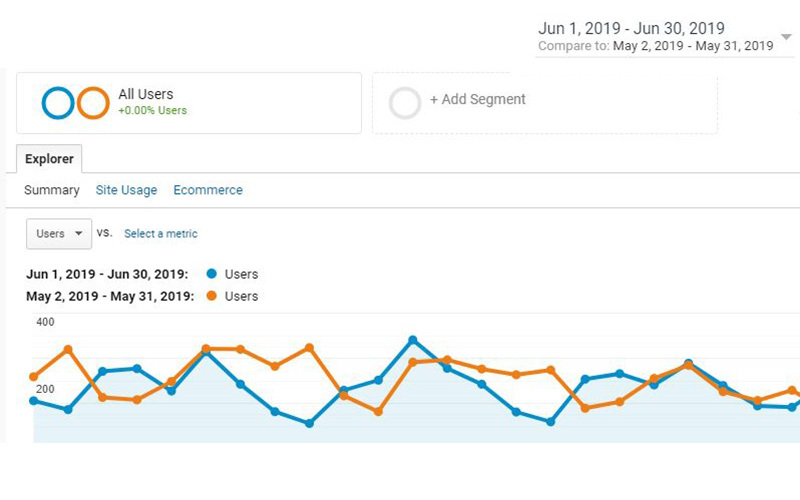
6. Weigh against Past Performance
Reports on Google Analytics by default displays results from the past 30 days, but you are free to select your desired range. You also have the option to use the "Compare To" checkbox so that you can compare your current results to that of any past date range. Always compare your current results with historical data when reviewing reports. Specifically, you would want to focus on the positive changes over time in the metrics that matter. Otherwise, KPIs won't be able to reveal much. It becomes all the more important when putting into practice any improvements. The only way to understand what works and what doesn't is by measuring it against past results, especially after any major modifications.
7. Make Use of Dimensions
By changing the primary dimension of your Google Analytics reports, you can further drill down to more detailed information. However, in some cases, you can apply secondary dimensions to provide more information in the same report. By adding Source as the secondary dimension, you can see a visual of the Source from the origin of the traffic. Secondary dimensions allow you to customize reports to the extent that you can cross-reference your data with other data points. You also have the option to save shortcuts to any of your customized reports. All report customizations will be automatically applied while accessing your reports via the shortcut.
8. Create Advanced Segments
By creating a Segment, you can review traffic based on specific criteria and moreover compare their performance to that of the entire website. You can apply Segments to any reports across Google Analytics. Segments can be created based on dimensions or metrics, visit date, etc. Segment reports are a powerful tool for analyzing reports with practical business applications. If you require even more detailed reports, ask your web developer to help with the advanced setup.
9. Use Filters to Clean Up Reports
Use filters to configure Google Analytics so that it excludes the traffic from your office, web developers’ and even your home IPs. This ensures that only real and clean traffic gets recorded. Analytics administration gives access to these settings to exclude traffic from other sections or systems of your website reserved for internal use.
10. Create Intelligence Alerts
You can set up custom alerts in Analytics as well as sign up for default alerts. While Analytics Intelligence is an exact replacement for your regular report review, it can assist you in identifying any important issues or opportunities. This becomes extra helpful in cases that you might have missed. The ideal way is to regularly review your KPI-based reports while taking the assistance of automatic Intelligence alerts to back up your analysis.
If you’re already a Google Analytics user but still find it difficult to analyze the data, use the pointers provided above. It will help you master Google Analytics data and increase your conversion rate. Add to that social media marketing, search engine optimization and your overall digital marketing strategy, and you can easily achieve optimal conversions.
If you aren’t entirely with your Analytics performance, feel free to have a conversation with our team of digital transformation experts. We’ve been using the same techniques to ensure successful conversions for our clients here at Amura, a top digital marketing agency in India for the last decade. Get in touch today!


Leave a comment
Comments (0)
Be the first one to comment.